Q Week 8 Homework Assignment (20 points) This week’s homework is to be completed using Minitab. For a quick review on time series analysis commands in Minitab, click here. The president of a small manufacturing firm is concerned about the continual increase in manufacturing costs over the past several years. The following figures provide a time series of the cost per unit for the firm’s leading product over the past 8 years. Year Cost/Unit ($) 1 20.0 2 24.5 3 28.2 4 27.5 5 26.6 6 30.0 7 31.0 8 36.0 Instructions: Input the data into Minitab Create a time series plot and use it to describe the pattern that exists in the data. Create a trend analysis plot What is the fitted trend equation? What is the average cost increase that the firm has been experiencing per year? Compute an estimate of the cost/unit for next year (year 9)
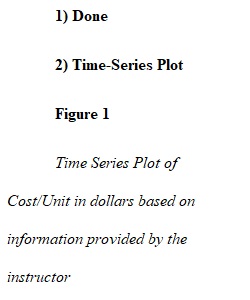
View Related Questions